Sliced Metrics
Automatically Slice Data Quality Metrics Across Every Dimension.
Lightup automatically slices Data Quality metrics, splitting individual metrics by categorical dimensions into sub-segments or "slices" — where each slice can have its own alert and trained monitor to detect incidents.
What Are Sliced Metrics?
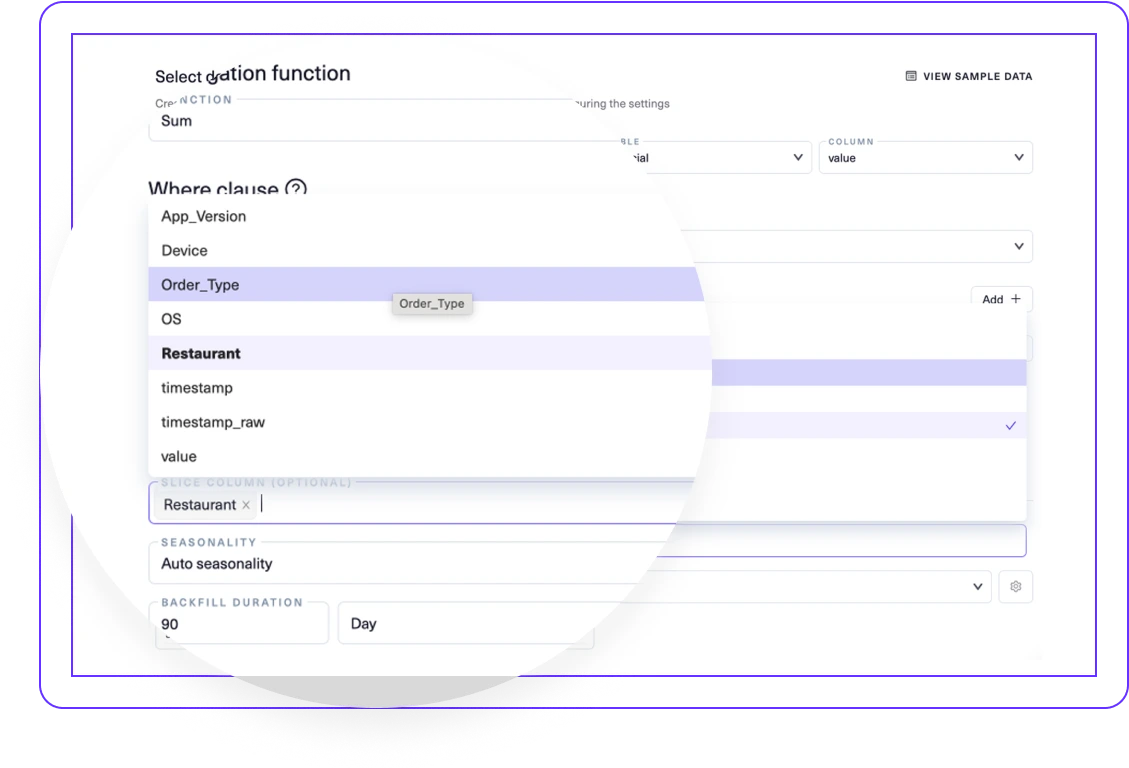
In Lightup, a sliced metric takes a single Data Quality metric and dynamically splits it into granular views — or slices — based on different dimensions.
Instead of manually writing metrics for every aggregated number such as total sales or order volume by region or brand, Lightup automatically slices individual metrics into subcategories — filtered and grouped by column values in tables, such as by city, store, brand, or product line.
Find Hidden Issues in Aggregate Metrics
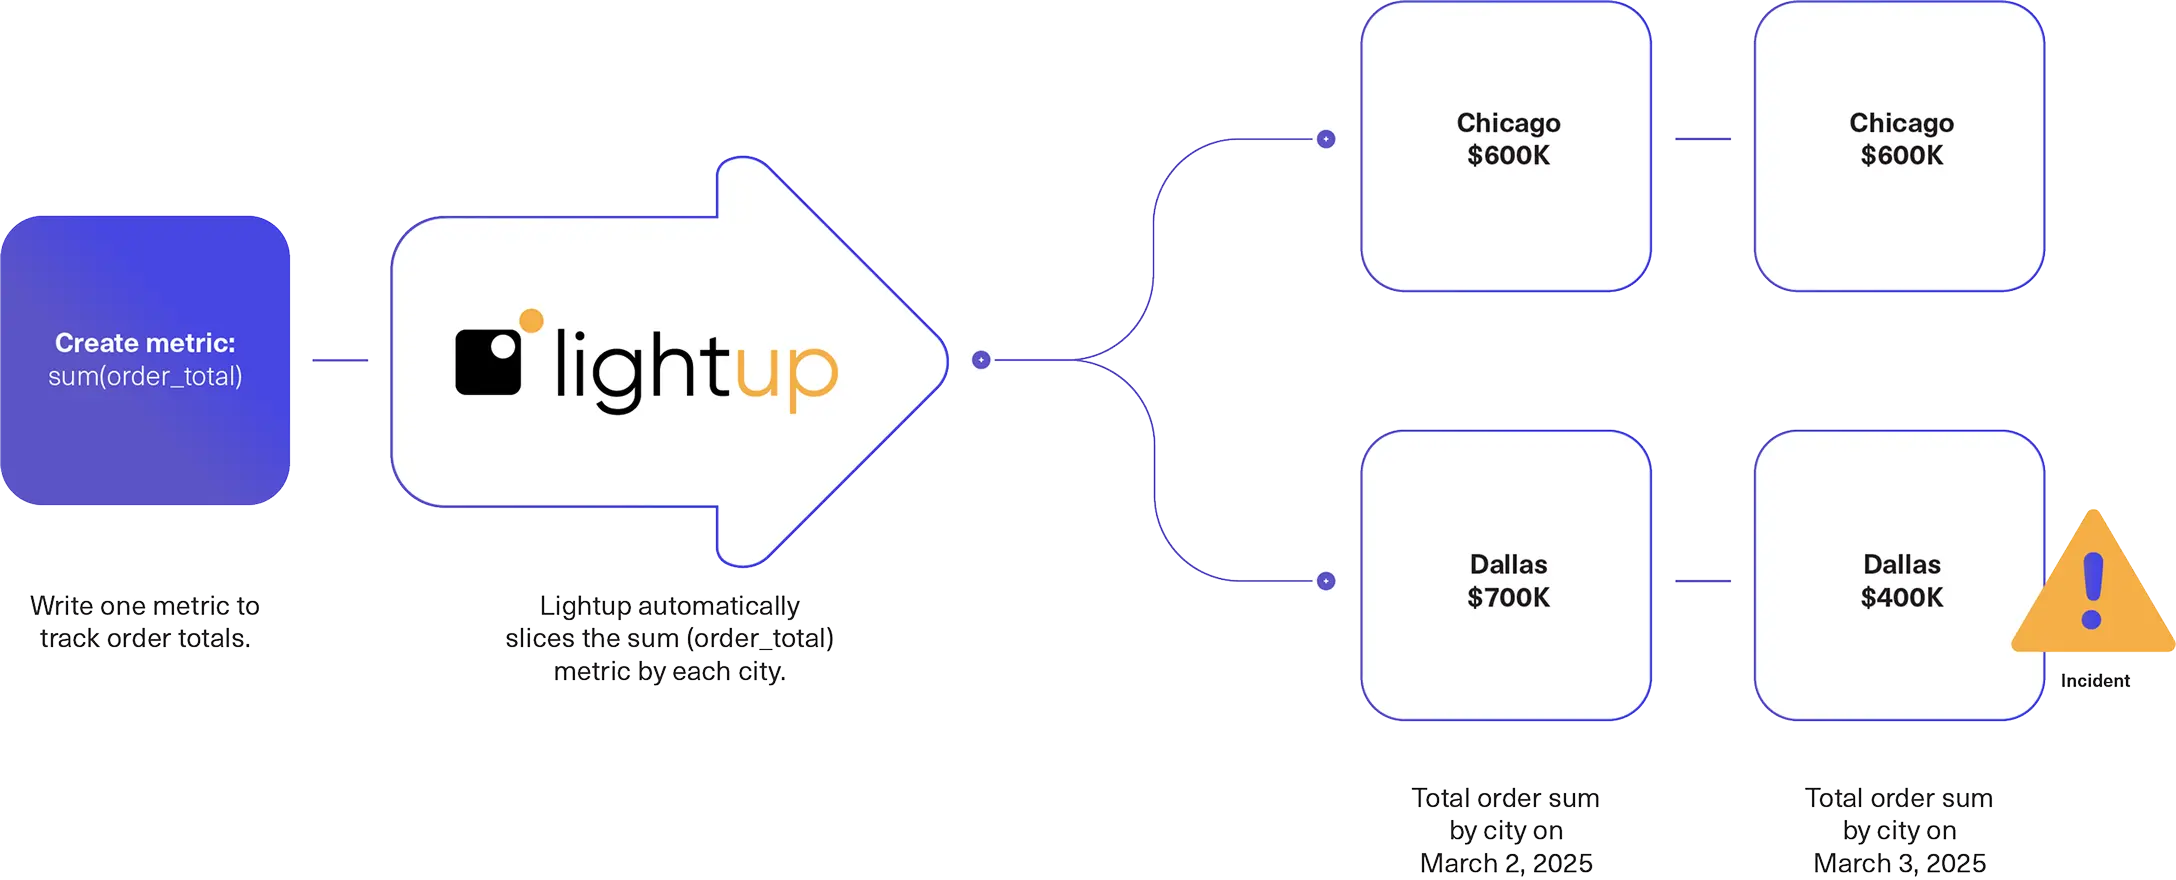
Imagine your enterprise receives one million rows of data a day from various cities. A small dip from $700K to $400K from a single city like Dallas — contributing just 10,000 rows — might go unnoticed in an aggregate sum total or traditional (unsliced) metric.
But with Lightup’s automated slicing, hidden issues in the aggregate sum total metric are detected and flagged as incidents, since each city’s total is tracked independently.
How Lightup Scales One Metric to Thousands of Data Quality Checks
Whether you’re monitoring metrics across 14,000 restaurants, 500 stores, or 50,000 products, Lightup’s sliced metrics make scaling Data Quality checks fast, efficient, and effortless.
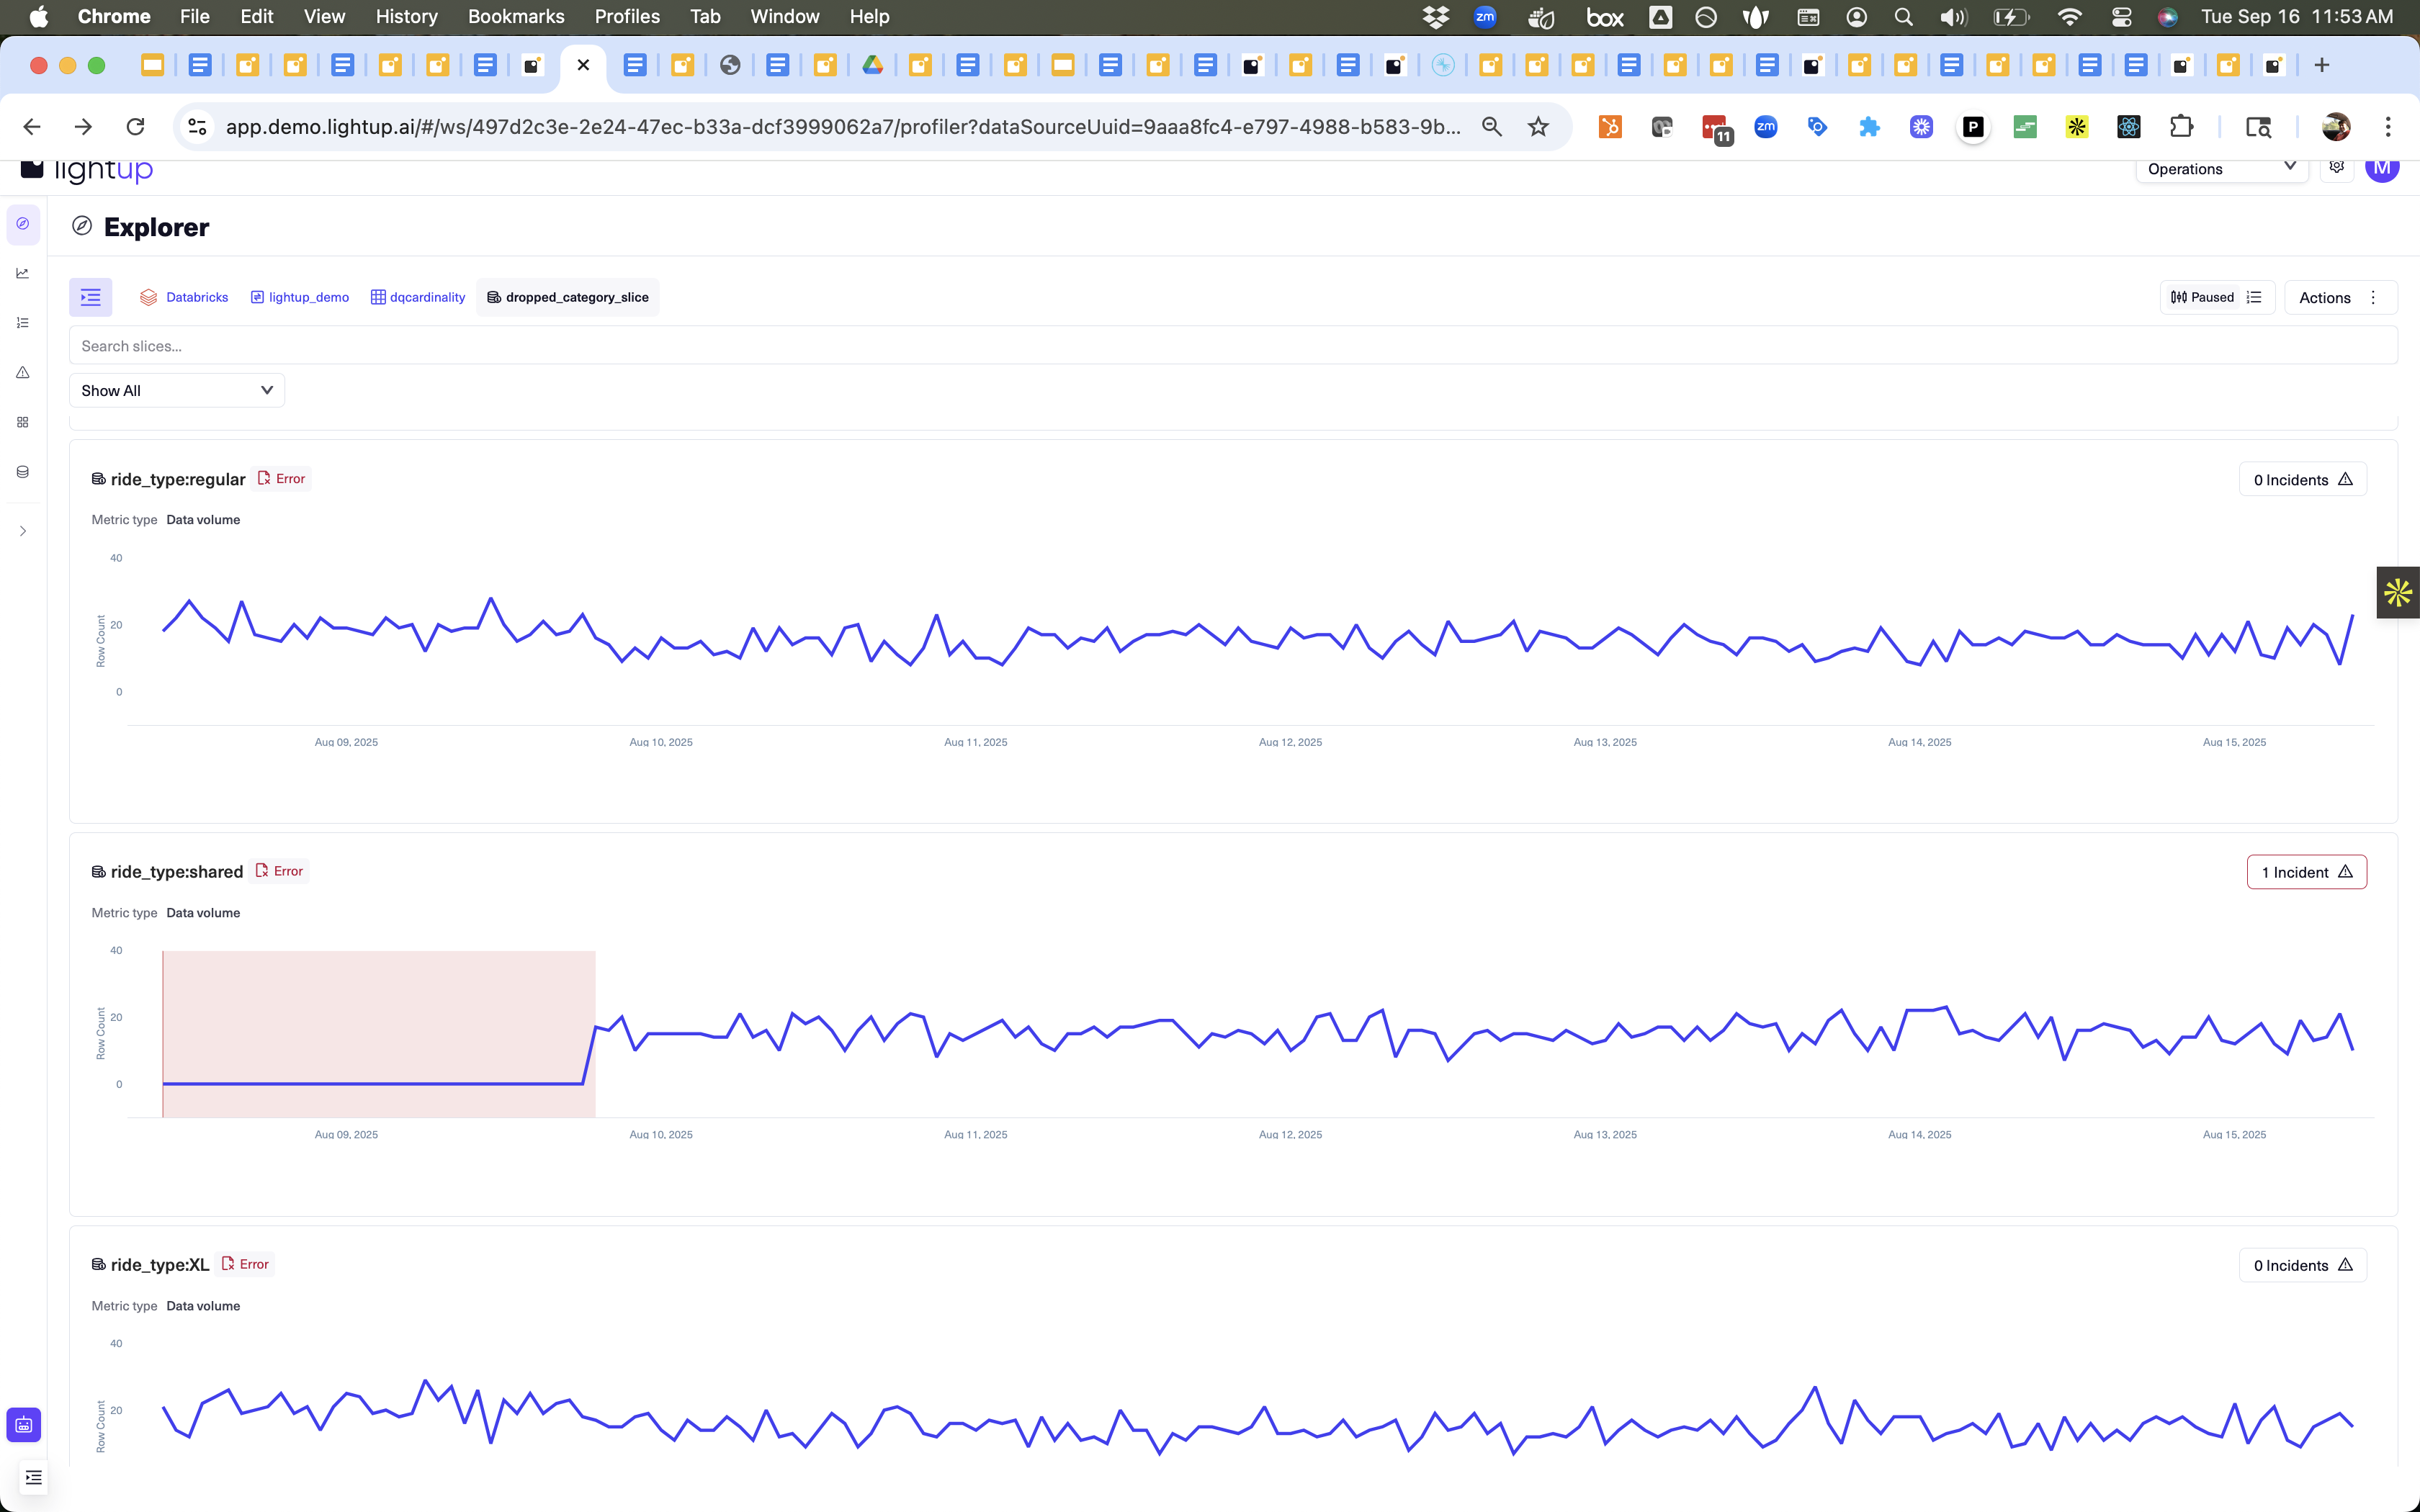
With legacy tools, you’d have to manually define and maintain individual Data Quality checks for each segment. With sliced metrics, defining one Data Quality metric automatically generates separate checks for each dimension, where each slice:
- Is independently monitored.
- Has its own historical baseline.
- Triggers alerts based on deviations unique to that slice.
- Adapts automatically as your business logic evolves.
- Can have customized training periods and alerting channels.
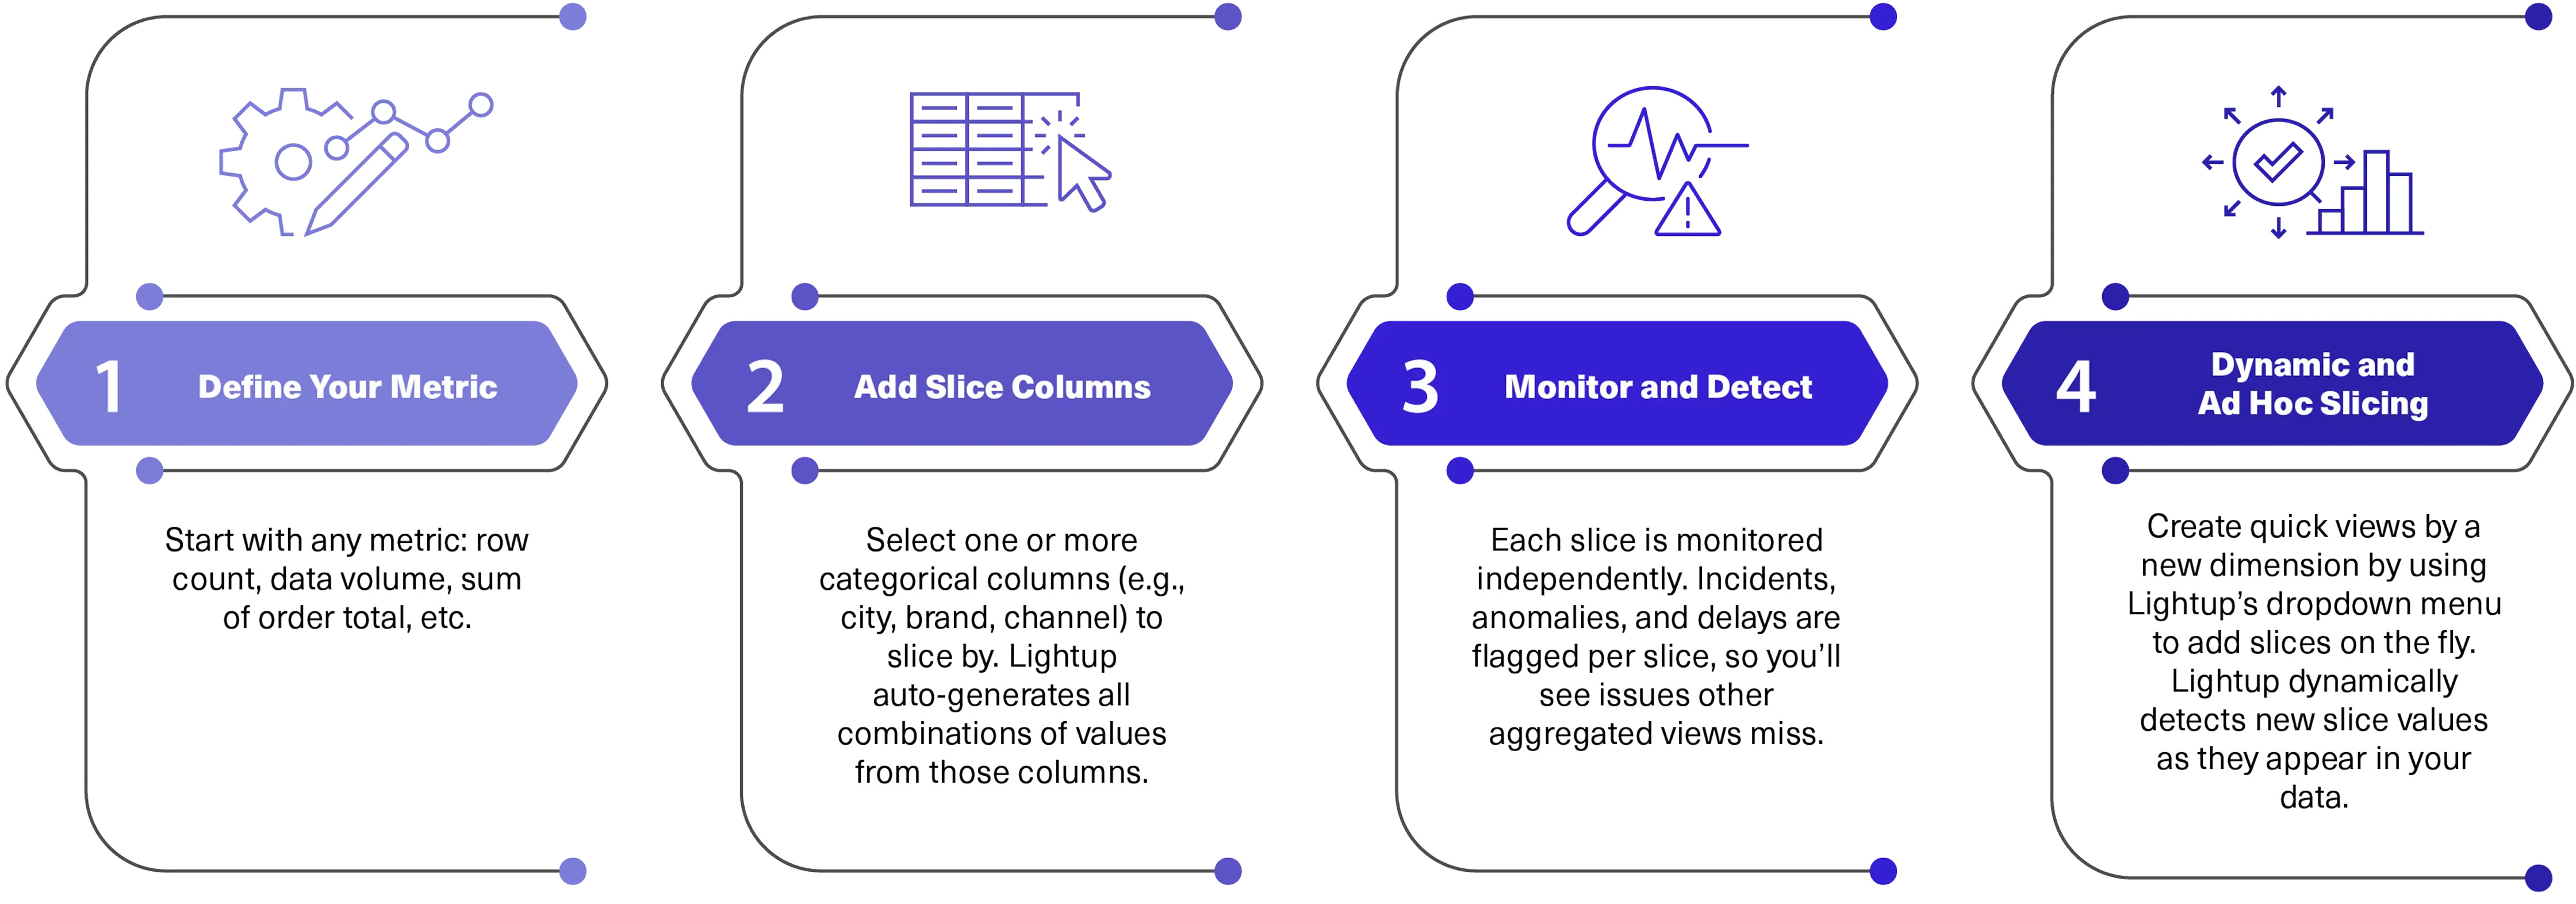
How It Works
Enterprise Use Cases

Retail

E-commerce
Finance
Resources
Docs
Slice Data Quality Metrics, Automatically.
With Slicing in Lightup, monitoring Data Quality becomes more precise, scalable, and aligned with your unique business logic.
See firsthand how easy it is to track thousands of metrics across granular segments with Lightup Slicing, start a free trial of Lightup today.